GIS Day 2017
Wednesday, November 15, 2017 at 00:00:03 EST 2 Comments
Geographic Information Systems
Preface:
Go to http://www.gisday.org/ to read more about GIS Day.
Geoinformatics:
Where am I? Where am I going? What was / is / will be there? Can you help me?
First you need input.
That can be from a land survey which refers to another land survey… which refers to another land survey… which refers to another land survey…
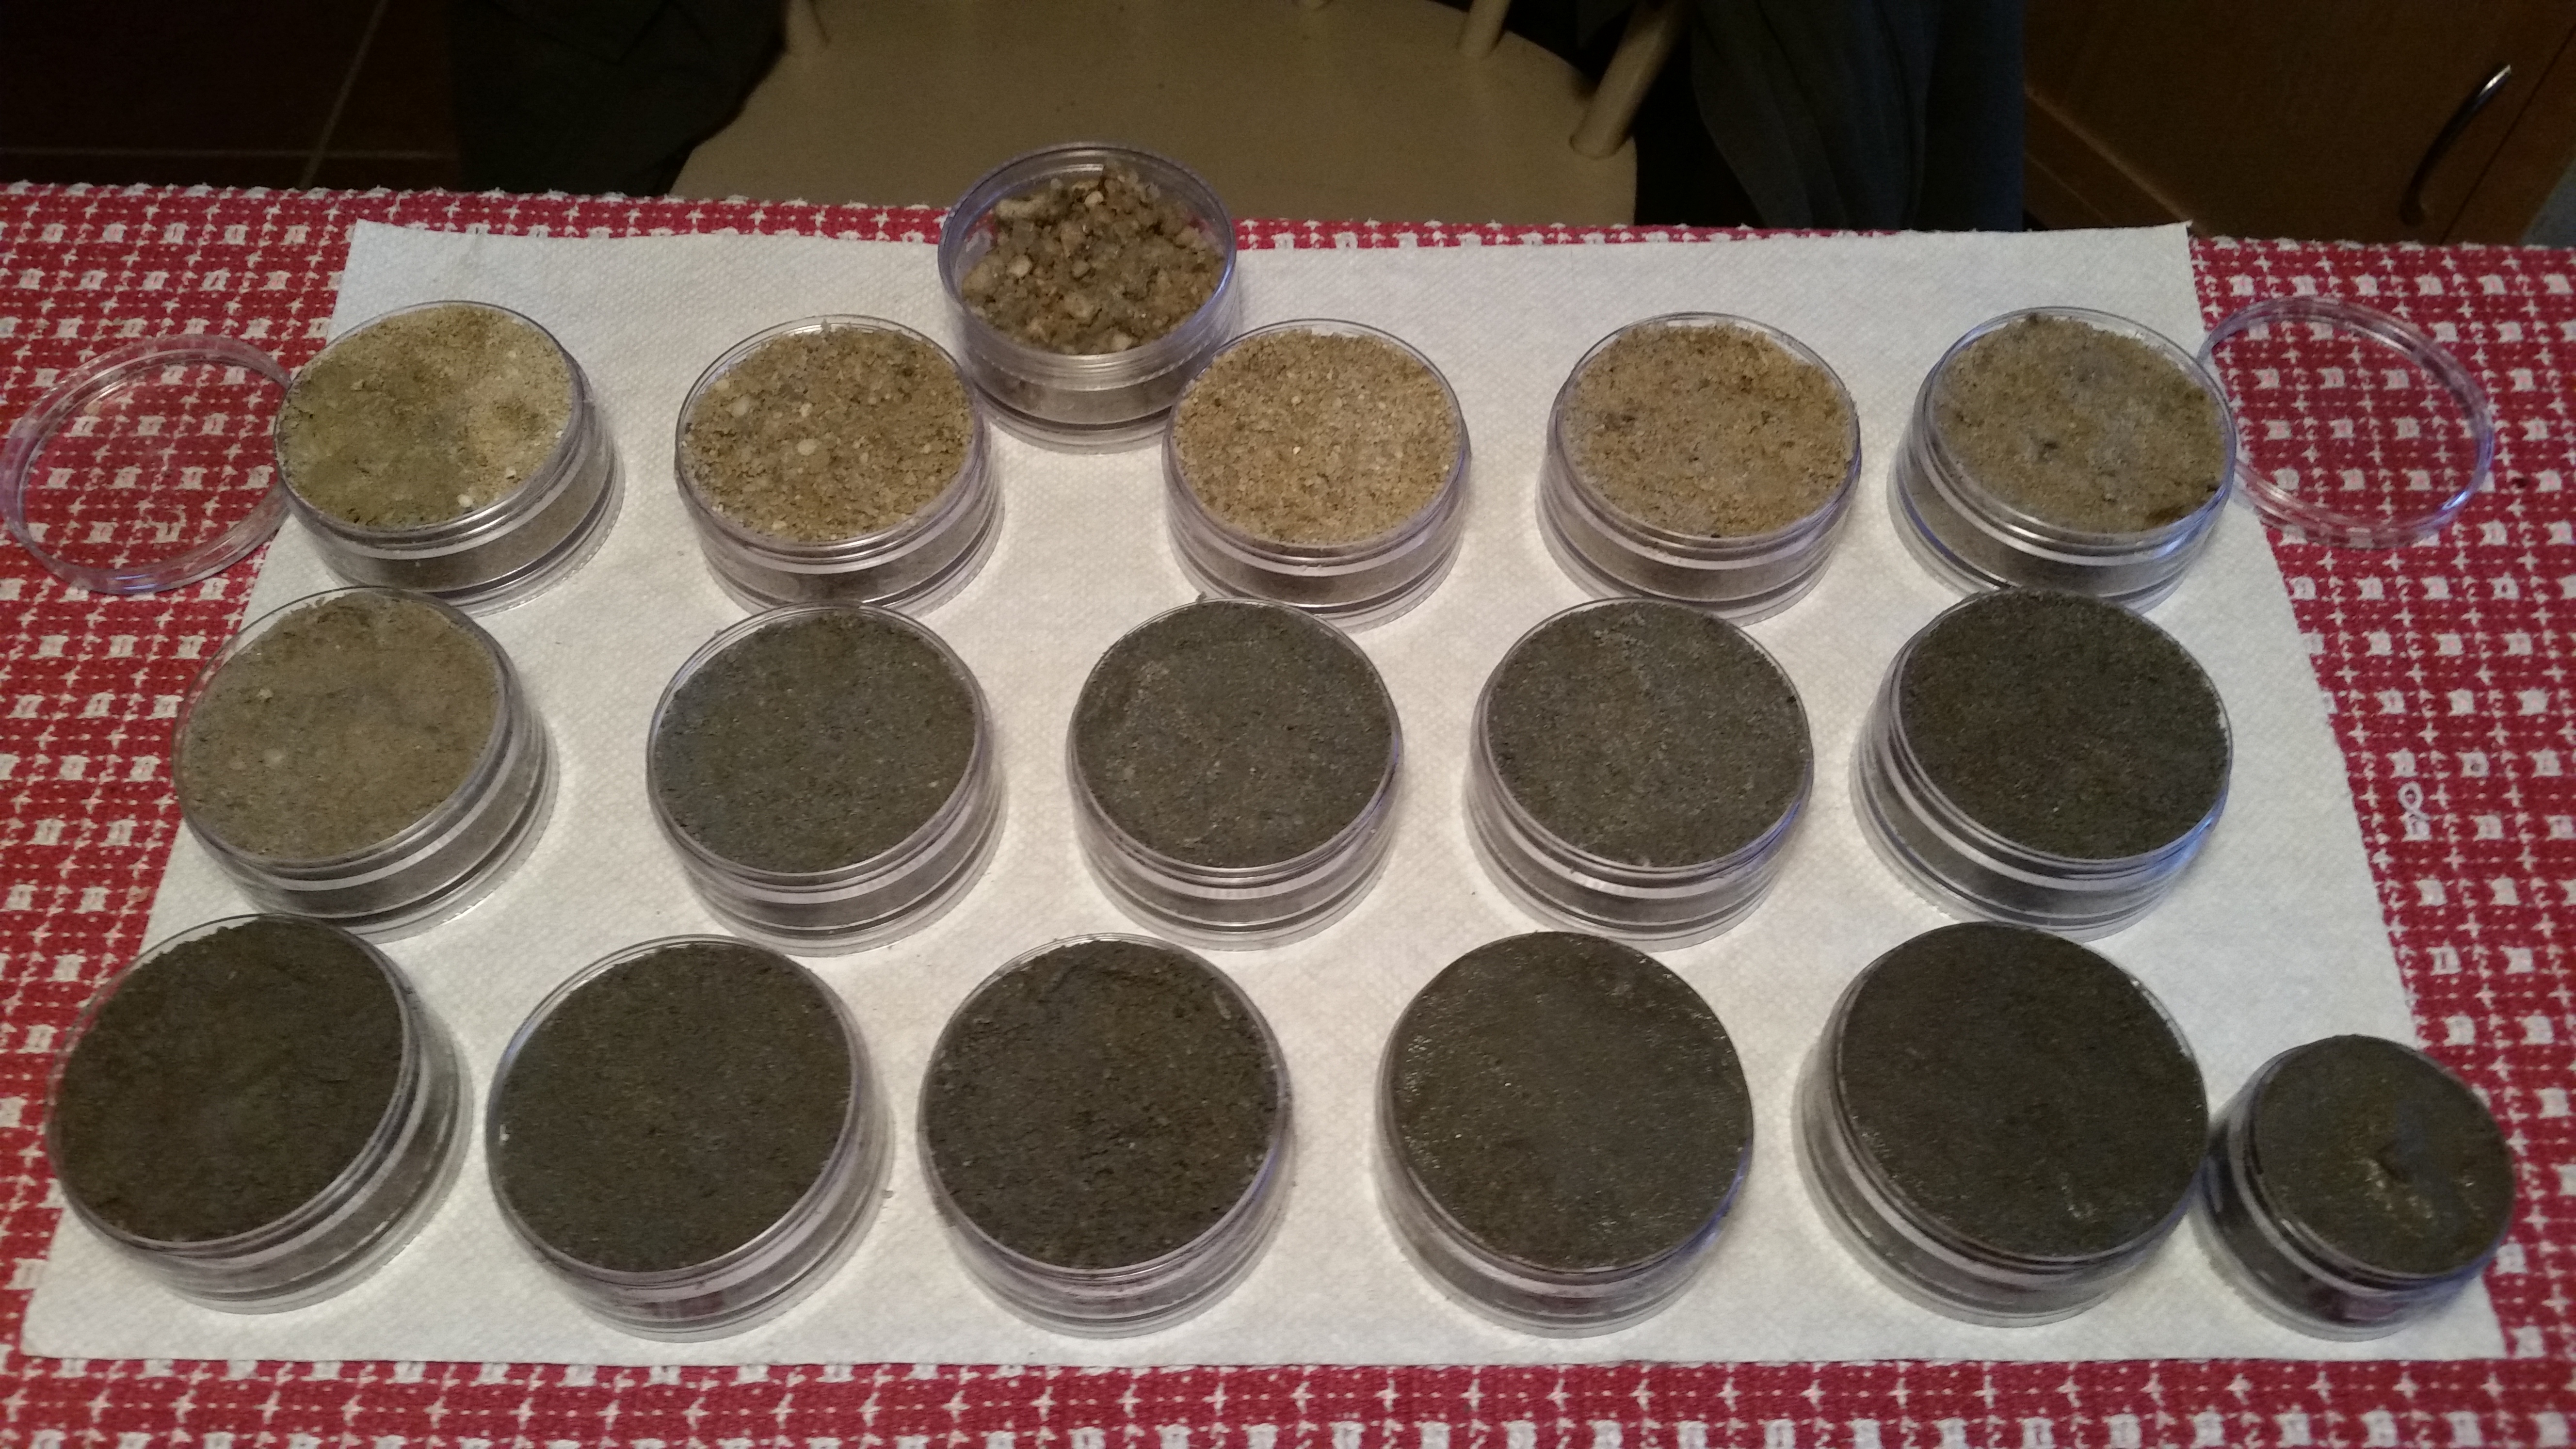
You could get soil samples. I recently had to have a new well installed. In order to figure how deep to place the submerged pump, Hoover had to get beyond the high iron levels.
Here is the sample:
January 17, 2015 at 7:19:38 am EST
Top Row:
10: Gravel.
20: More gravel and small pebbles.
25^: Loads of pebbles (clear Cape May Diamond types, white, pink, tan). Beautiful, if you ask me.
30: Sand (1 mm diameter) high iron content.
40: Sand with iron (getting finer).
50: Sand still getting finer.
Middle Row:
60: This almost looks like beach sand.
70: Grey sand (now that’s different).
80: Grey sand.
90: Grey sand.
100: Now we’re talking, it’s getting darker.
Bottom Row:
110: Still darker (more organic).
120: Still darker (more organic).
130: Still darker (more organic).
140: Still darker (more organic).
150: Now that’s almost black (rich organic, no iron).
Little one: Material used to hold pipe in place.
Then you need storage.
Physical storage for maps, photographs, deed books, core samples of soil, rock or ice.
Digital storage going back to magnetic tape, CDs or to today a multi Terabyte server farm.
I need to get a drawer for large maps.
Then you need to process the information.
Usually a person, computer and or both.
Then you need output.
Create a map by hand or digitally. or computer application.
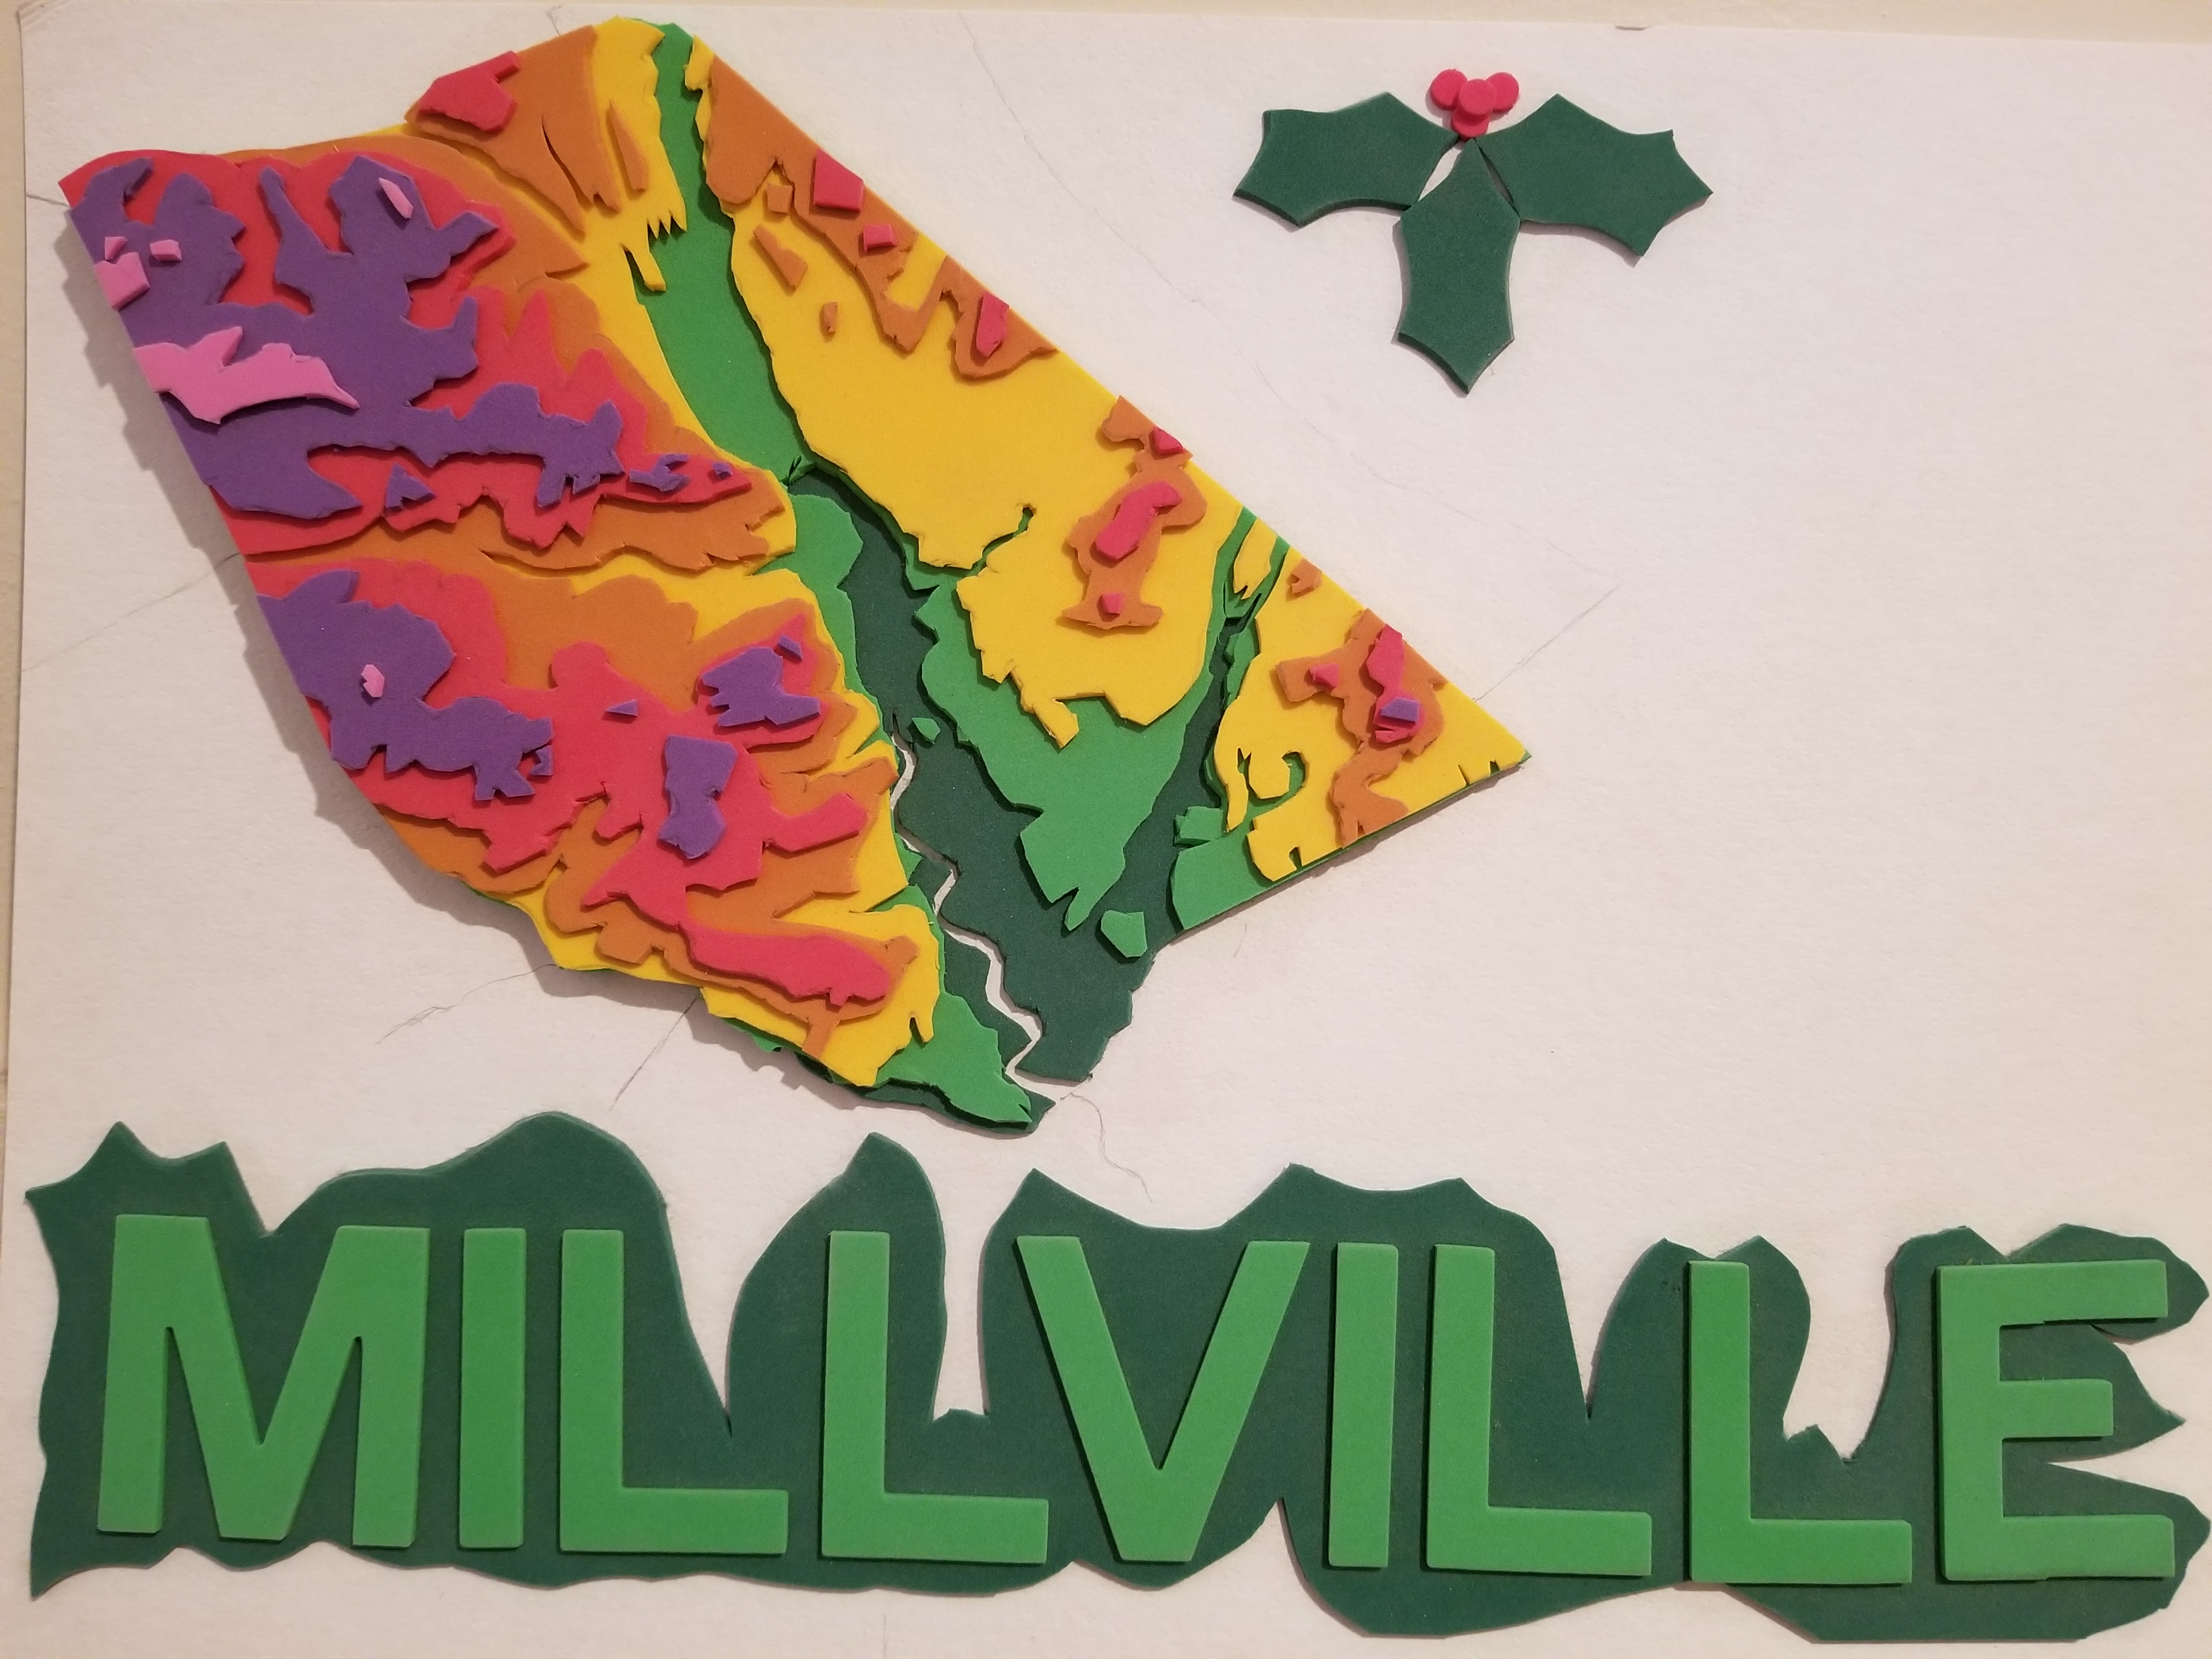
Millville, New Jersey Topographic Map derived from ESRI elevation .shp files.
Then you need to share that information.
Locals to New Jersey check this website: http://www.nj.gov/dep/gis/
Go to NJ-Web Geo 3.0.
If you scroll down to the layers of imagery, you can see topographic maps from the 1880’s and 1960’s with modifications, aerial photographs from 1930, NJDEP wetlands basemaps from 1970, tidal maps from 1977, infrared from 1995, 2002 and 2007. Then more images have been collected at a faster pace natural for 2007, 2010, infrared for 2012, then natural for 2012, 2013, 2015 and infrared for 2015.
Google Earth, Google Maps, Bing, Mapquest, ESRI, too many to count.
To see how many, check this link from checking the latitude and longitude of Millville, New Jersey from Wikipedia.
https://tools.wmflabs.org/geohack/geohack.php?pagename=Millville,_New_Jersey¶ms=39.390094_N_-75.054797_E_region:US_type:city
At this point, Google Maps and other maps are collaborative, so people and businesses can verify information (with some error) and provide photographs.
If you take a picture of a landmark with a new digital camera or a smartphones, the photograph will include embedded date, time and location including orientation.
Interstate Highway System:
In the United States, we have a system of roads that run from coast to coast, from Mexico to Canada, and between major cities.
I just wanted to create headings of G, I and S.
U.S. Department of Transportation: Federal Highway Administration: https://www.fhwa.dot.gov/
Spatial Intelligence:
Spatial Intelligence involves layers of multiple data sets based on location or time.
You can create a map that has applications that connect business, education, other industries and organizations.
Check ESRI for other GIS information software and training: https://www.esri.com/en-us/home
As with many of my posts, I will be editing to correct or enhance my blog.
This is post 3 of my alphabet posts.
Act Boldly. Change Deliberately.
Educate Frequently.
GIS Day 2017.

Pingback: Happy, Healthy, Hiking. | Ted Prohowich, Jr. - Blog
Pingback: Introspection, Inspiration and Inception. | Ted Prohowich, Jr. - Blog